
Dec 12
preview
Mention back-testing to an investor and you’ll usually get groans (too much work) or howls of protest (backward looking!). Intriguingly, it's hated by believers and non-believers alike. The former associate it with tedious Excel spreadsheets. The latter doubt the past can teach us much about the future. They’d rather guess (or look at charts).
So what exactly is back-testing?
At its core it is simply reconstructing, with historical data, trades that would have occurred in the past using rules defined by a given strategy. The result offers statistics to gauge the effectiveness of the strategy IF HISTORY WERE TO REPEAT ITSELF. This is where the non-believers shut their ears.
Is it worth it?
Definitely. Even if you think the past is a really poor predictor of the future, it’s not a bad place to look for guidance. Implicitly, every forward looking strategy is in part informed by historical data. Fundamental models survived because they proved useful in the past. Technical patterns (triangles, breakouts) and indicators (MACD, RSI) derive their worth entirely from observable past outcomes.
At a minimum, back-testing shows how well your hypothesis would have done in the past and forces you to argue why you think it’ll be different this time (if you do). More importantly, it can hint at the “convexity” of the trade’s risk-reward: what is at stake against the return you expect to receive.
How hard is it?
That depends on the toolkit you have. The standard workhorse is Excel. In TOGGLE, you can use the Scenario tool to bypass time-consuming tasks like data downloading, searching for comparable periods etc. Here is an example. Let’s say you are convinced that RSI below 30 (the usual rule of thumb for “oversold”) means TSLA is a good buy.

In TOGGLE, this is incredibly easy to test. You open the Scenario tool, specify the condition, run the scenario and - voila!
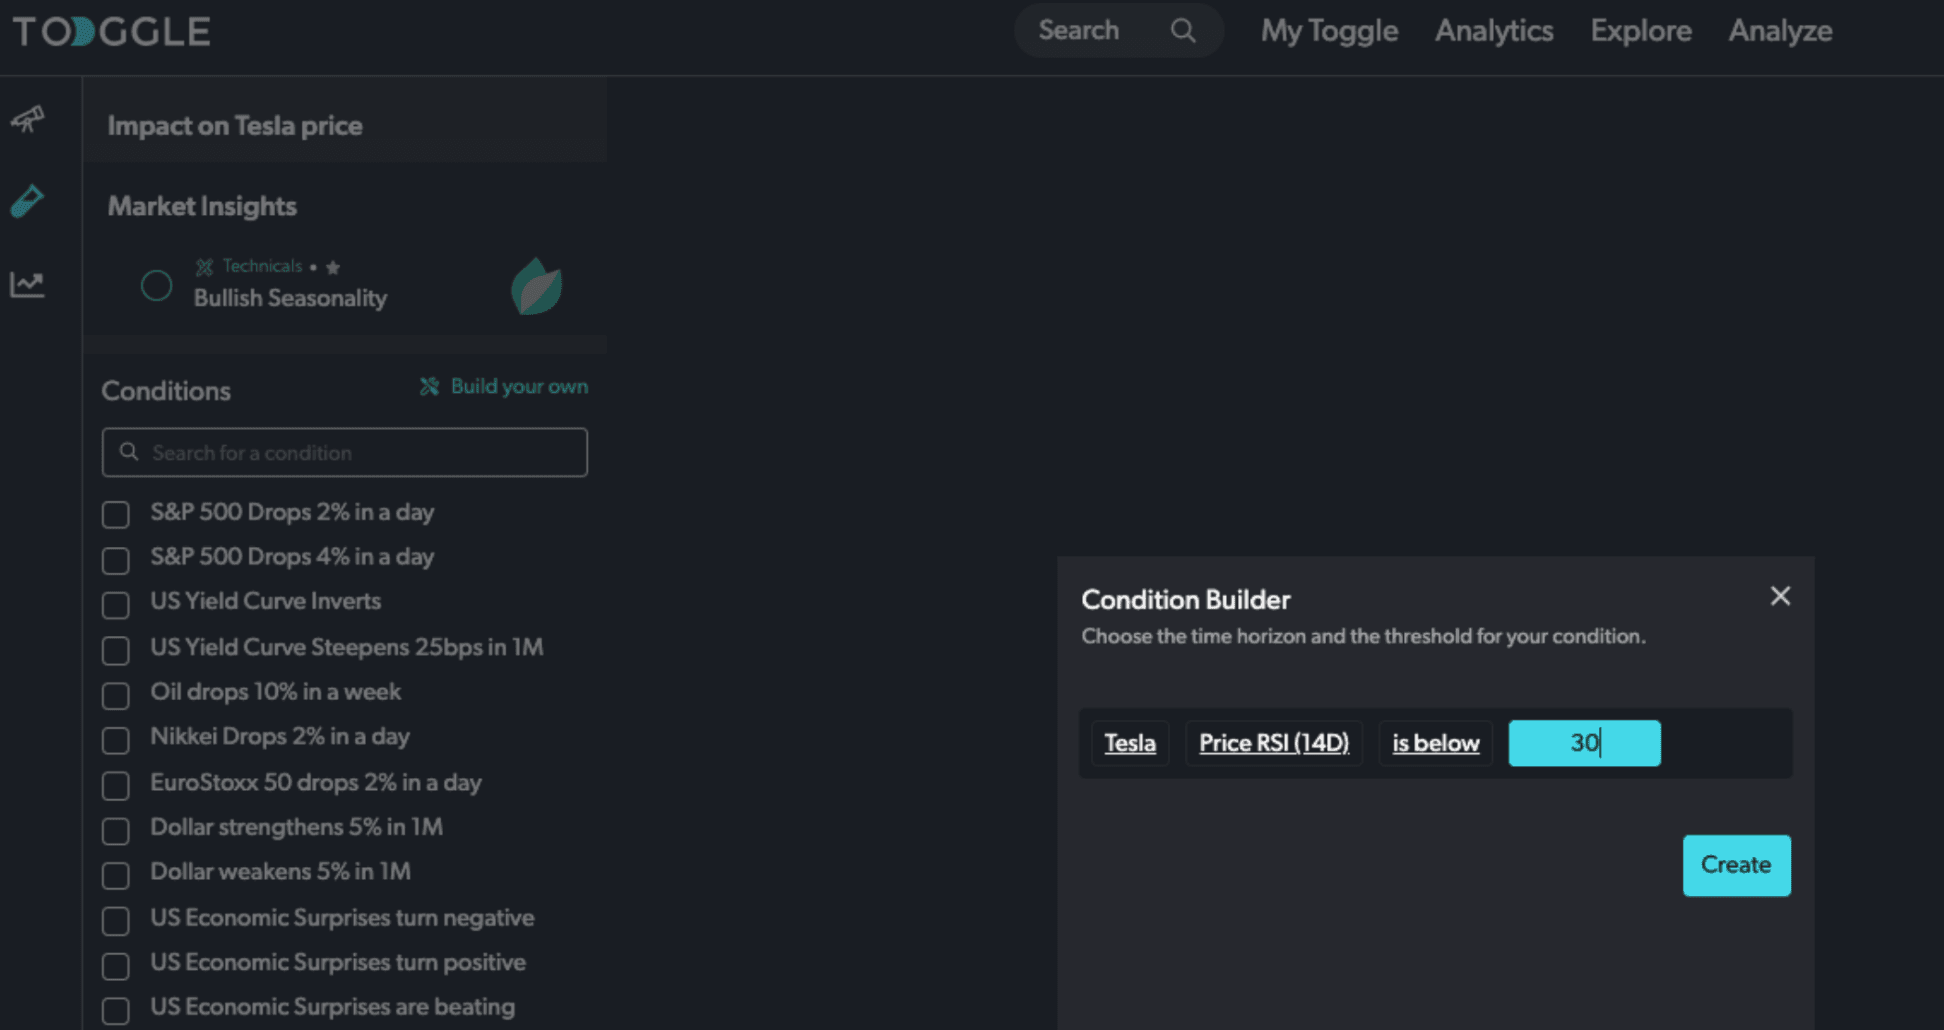
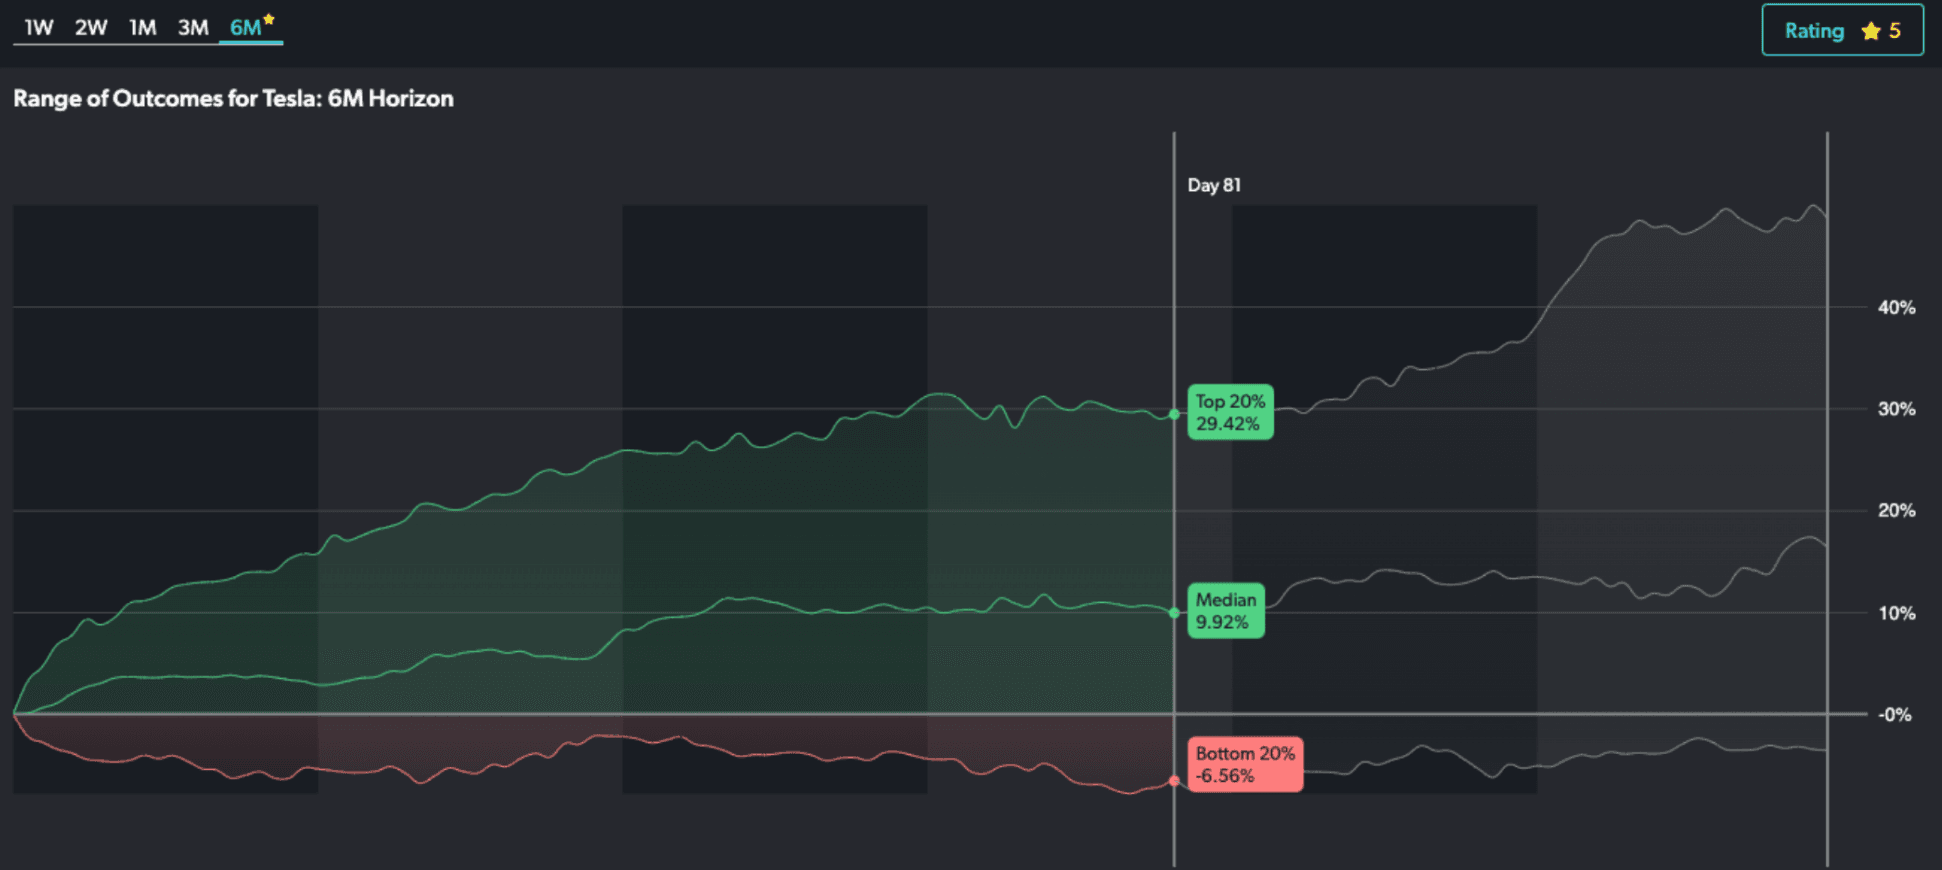
TOGGLE will dig back as far as it’s able to go, identify every past episode with RSI below 30 in seconds (that alone can take hours in Excel) and give you the full rundown: expected return, total number of episodes, and a quick sense of how badly (and how often) the trade would have previously gone.
It’s so easy that, really, you have no excuse NOT to do it.
While back-testing is highly recommended, there are a few principles to adhere to:
Is back-testing worth it?


Up Next
Dec 12
preview