
Dec 12
preview
TLDR: when a large stimulus is announced, Oil posts the strongest gains, along with consumer stocks

As the one-year anniversary since the WHO declared COVID-19 a pandemic rapidly approaches, there is some hope on the horizon considering declining caseloads and accelerated rates of vaccine distribution. Even with these positive signs, the United States (and the world at large) is still experiencing the economic damage that the pandemic left in its wake.
President Biden has made his new administration’s top priority to curb the pandemic and its economic impact. He has pushed congress to enact a $1.9 trillion dollar stimulus package that includes direct cash payments, augmented unemployment benefits, money for testing and vaccine distribution, and state and local financial relief, among other benefits.
This would be a historically large spending package, similar in magnitude to last year’s “Coronavirus, Aid, Relief, and Economic Security Act” (CARES Act) enacted in March of 2020 when the pandemic first hit. It’s likely to have a rippling impact on many sectors of the economy. You may be wondering, “how should I position my portfolio for the next few months?”
We looked at five of the largest expansionary fiscal policy/stimulus packages passed in the last twenty years to find out.
1. 2001 Economic Growth and Tax Relief Reconciliation Act
2. Economic Stimulus Act of 2008
3. American Recovery and Reinvestment Act of 2009
4. Tax Cut and Jobs Act of 2017
5. CARES Act of 2020
Examining returns after these acts were signed into law by the President (they had already been passed by the Congress), you’ll notice an interesting behavior — the S&P 500 index typically dips initially, adhering to the old adage “buy the rumor, sell the news”. It then rallies, getting back to breakeven after 2 weeks and continuing to rise the remainder of the 3 month period, as the expansionary fiscal policy makes its way through the economy.
You may be thinking, doesn’t the market typically rise over time? You would be right - you can see the typical return over a quarter highlighted in blue below - but you’ll notice that, post-stimulus, the S&P 500 typically outgains by 4.21%.

Given the (frequent) concerns about fiscal stimulus leading to inflation, you may wonder how commodities will fare.
Let's see the graphs!
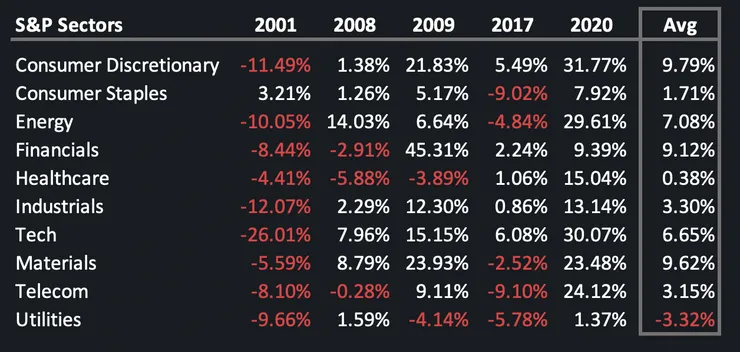
And what about the S&P sectors? Do they follow a similar pattern?

Let's dive deeper into each bill.
The 2001 Economic Growth and Tax Reconciliation Act was an income tax cut pushed by the Bush administration in response to the 2001 recession. Signed on June 7th, 2001, this bill changed other aspects of the tax code such as expanding the Earned Income Tax Credit and raising the child tax credit.
Here is what happened to financial markets after its implementation:
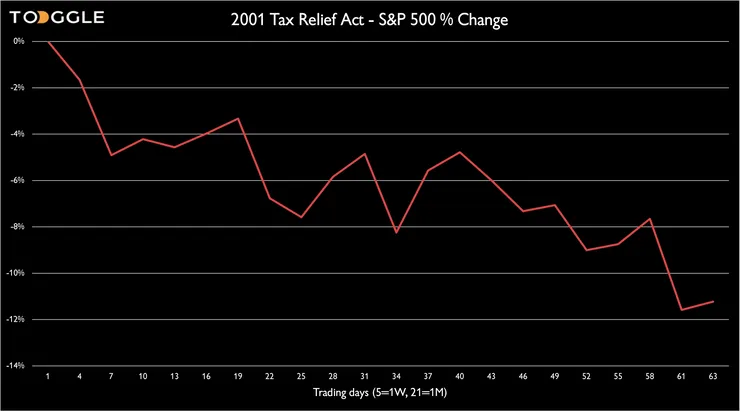
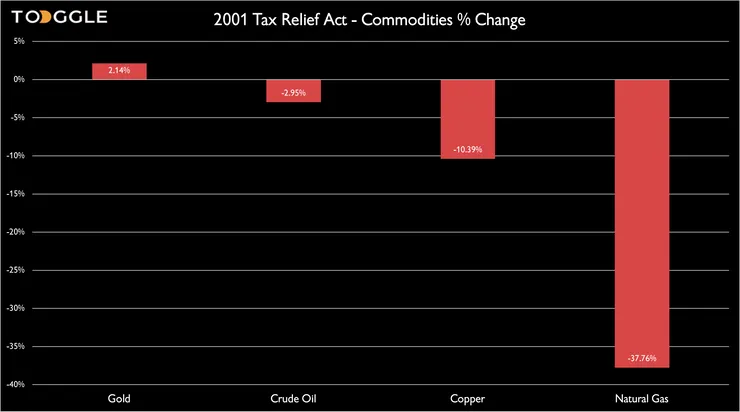
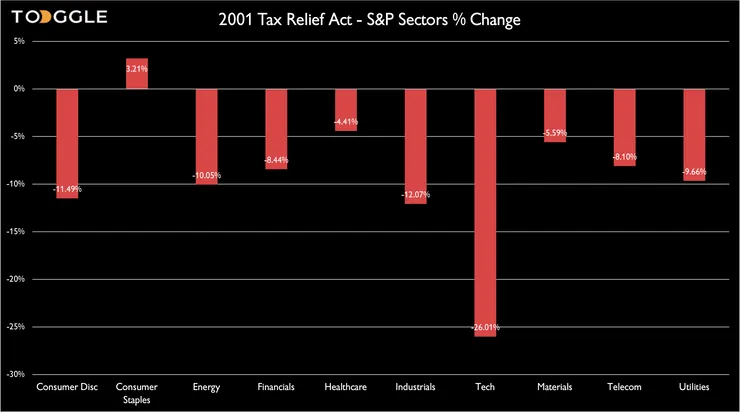
The 2001 Economic Growth and Tax Relief Reconciliation Act, which was implemented in the midst of the brunt of the 2001 recession, did not curb widespread market downturns. The only exceptions were small gains in consumer staples and gold which were likely seen as safer options amidst the recession. As we will later see, the results from this legislation were uncharacteristic.
The Economic Stimulus Act of 2008 was signed into law by President Bush on February 13th, 2008. This legislation was the result of concerns of an impending recession due to worrisome economic indicators. This bill provided individual tax rebates for the 2008 tax year, created new business tax incentives, and increased the threshold for conforming loan limits that the Federal Housing Administration was allowed to insure.
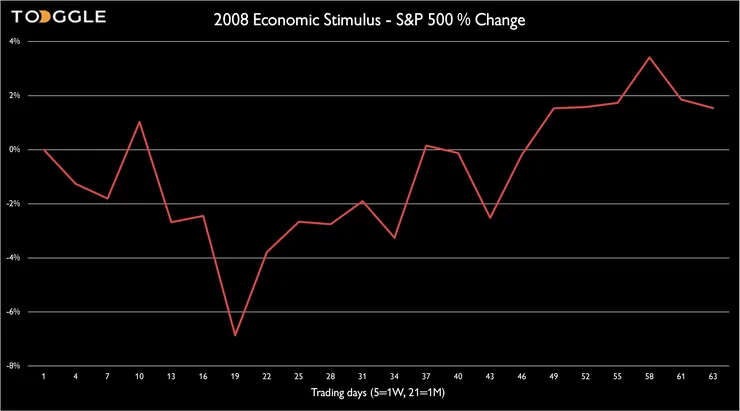
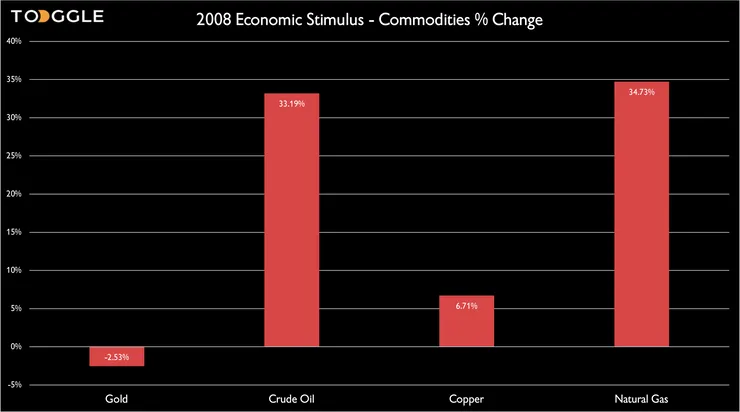
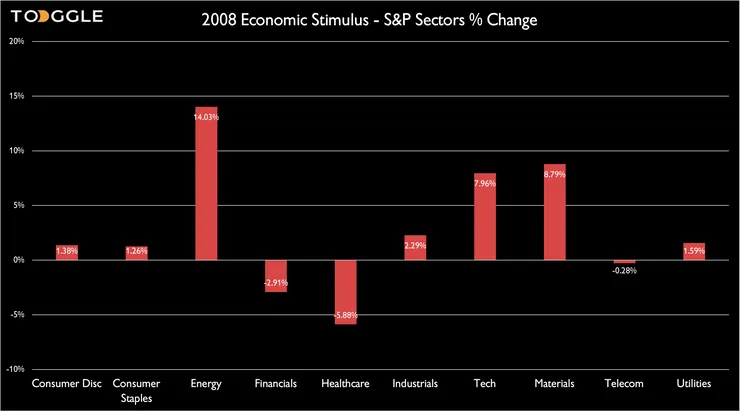
Similarly to the trends of the aggregated equity market benchmarks above, the Economic Stimulus Act of 2008 led to initial dips in these benchmarks before rebounding to an overall gain at the end of this three month period. These final gains were muted compared to some of these other examples, possibly reflecting the relatively smaller cost of this package at just roughly $168 billion. Though outperformance was reflected in the energy sector (crude oil and natural gas commodity prices as well).
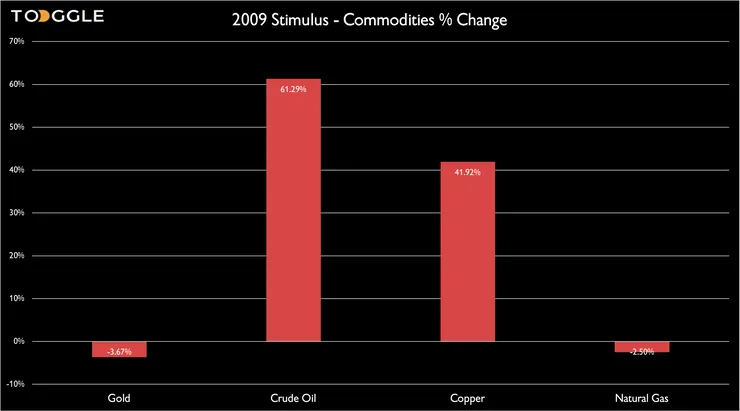
The American Recovery and Reinvestment Act of 2009 was a $787 billion dollar relief package signed by President Obama on February 17th, 2009. To curb the effects of the “Great Recession,” it proved a mixture of tax relief, unemployment benefit extensions, and allocated money for federal contracts to spur private sector investment, among other spending.
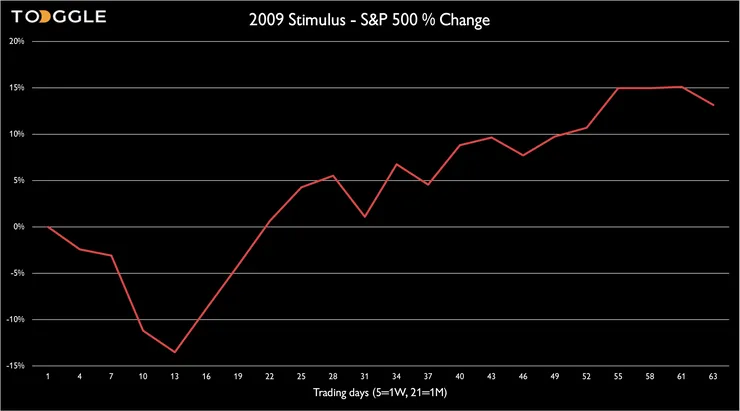
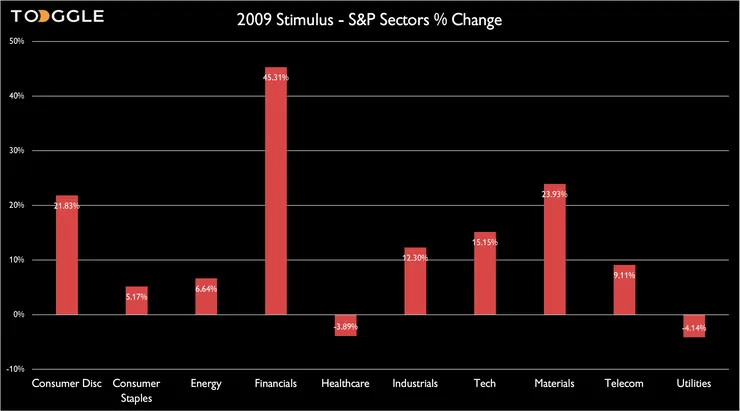
After the American Recovery and Reinvestment Act was signed, we see the initial dip in the equity benchmarks before a positive rally. This rally in the S&P 500 was larger in this stimulus package than the 2008 economic stimulus package. Most notably, the financial sector rebounded to the greatest extent, possibly reflecting the beginning of the recovery after the issues that surrounded many financial institutions that predicted the economic crisis.
The Tax Cuts and Jobs Act (TCJA) was a 1.5 trillion dollar tax reform law signed by President Trump on December 22nd, 2017. Unlike the previous examples, it was not enacted during a recessionary period. It made significant changes to the tax code. It lowered marginal tax rates, lowered the corporate tax rate, and made changes to some of the itemized deductions.
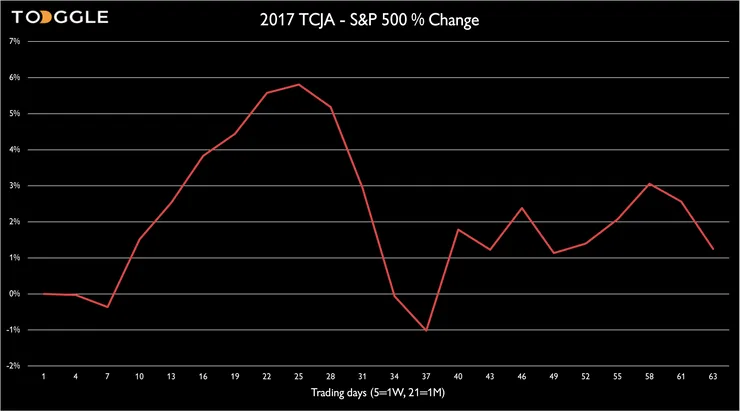
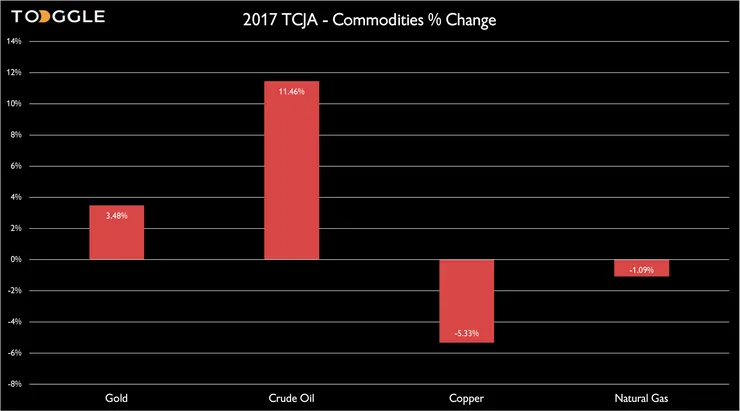

The period following the implementation of the TCJA, followed a slightly different trend than the previous two stimulus packages, which increased expenditures rather than cut revenue. The equity benchmarks show a dip in the middle of that three month period rather than the beginning of it, before rebounding into a gain reflecting an overall bull market. There was a significant disparity between the returns of specific S&P sectors. Information technology and consumer discretionary performed the best, while communications and consumer staples were the biggest losers.
The Coronavirus Aid, Relief, and Economic Security Act (CARES Act) of 2020 was a 2.3 trillion dollar stimulus bill that was enacted on March 27th, 2020, in response to the economic fallout from COVID-19-related restrictions. It was the largest distinct spending package in U.S. history. The CARES Act included provisions such as direct aid to taxpayers, forgivable loans to small businesses, increased unemployment benefits, and other relief to industries impacted by the pandemic.

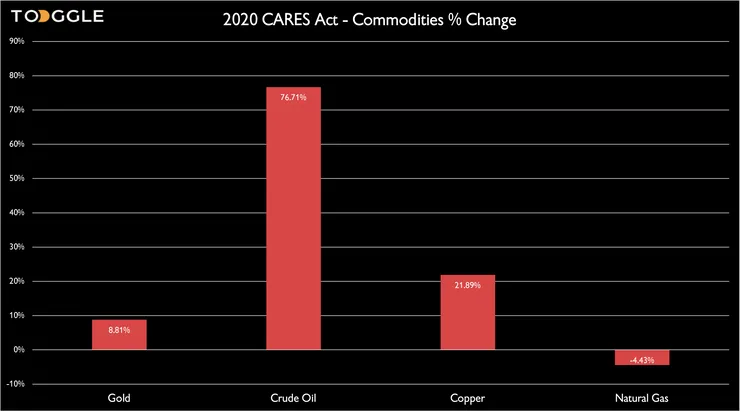
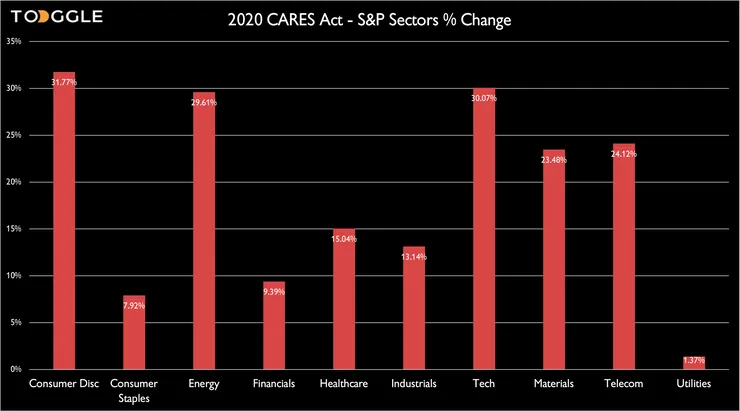
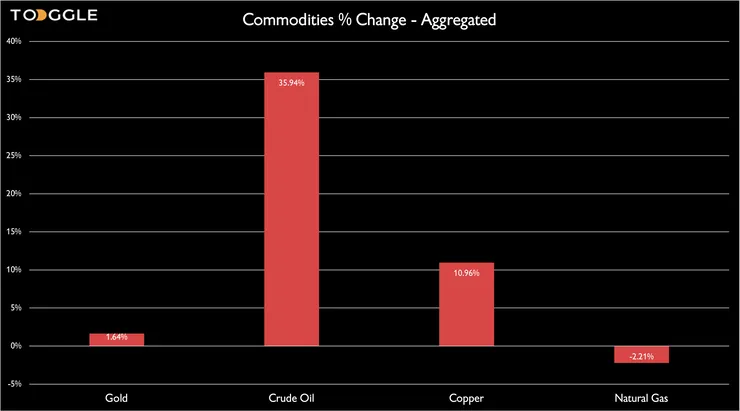
The largest discrete spending package among these examples preceded the greatest overall gains in these equity benchmarks. The CARES Act was passed along with unprecedented expansionary monetary policy, and financial markets responded. The initial dips that occurred in the two previous expenditure packages were far more muted this time. The following gains were more substantial across the different sectors as well. Commodity prices overall also showed substantial gains with the exception of natural gas futures, which showed a small dip.
Given markets remain near all-time-highs, how might the new stimulus impact price action? Though we are technically out of a recession, many parts of the economy do not feel so. Unemployment remains high, and many industries have large structural hurdles to overcome as life becomes more "normal" again.
Given the magnitude of stimulus, perhaps 2020 is a good proxy. The major difference being that, currently, the S&P 500 is barely off all-time highs vs down 25%+ a year ago.
So maybe 2017 provides a better example - the market was also at all-time-highs then, and stimulus came outside of a recessionary period. But the situation is very different now - the hospitality industry is still reeling, and many more Americans are out of work.
If either case can be a lesson, markets are likely to respond favorably to Biden signing a stimulus into law.
Given sharply rising rates and looser policy from the Fed, many investors are worried about inflation. Looking through history, this "reflation" concern seems to have been misplaced, with Gold typically seeing a muted response.
So...if not gold, how do I position?
Consumer Discretionary stocks are likely to perform well as the economy restarts and people get back to, well, consuming. The energy complex has already seen a big rally, but there could be room to rise further. Finally, Industrials and Materials may see rises, and investors should likely avoid Utilities.
Reflation is Nigh


Up Next
Dec 12
preview