Dec 12
preview
AT&T is one of those companies where you’re not sure what’s really happening behind the scenes, but you would be distraught if you suddenly had “no service.” Starting with the rise of investor fears, coupled with finding out 5G could pose detrimental consequences to flights, the stock has taken a large hit over the past few weeks. It seems like since the stock hit all-time highs in May, it's been on a downward trajectory since. So, what does TOGGLE AI have to say about this?
TL;DR
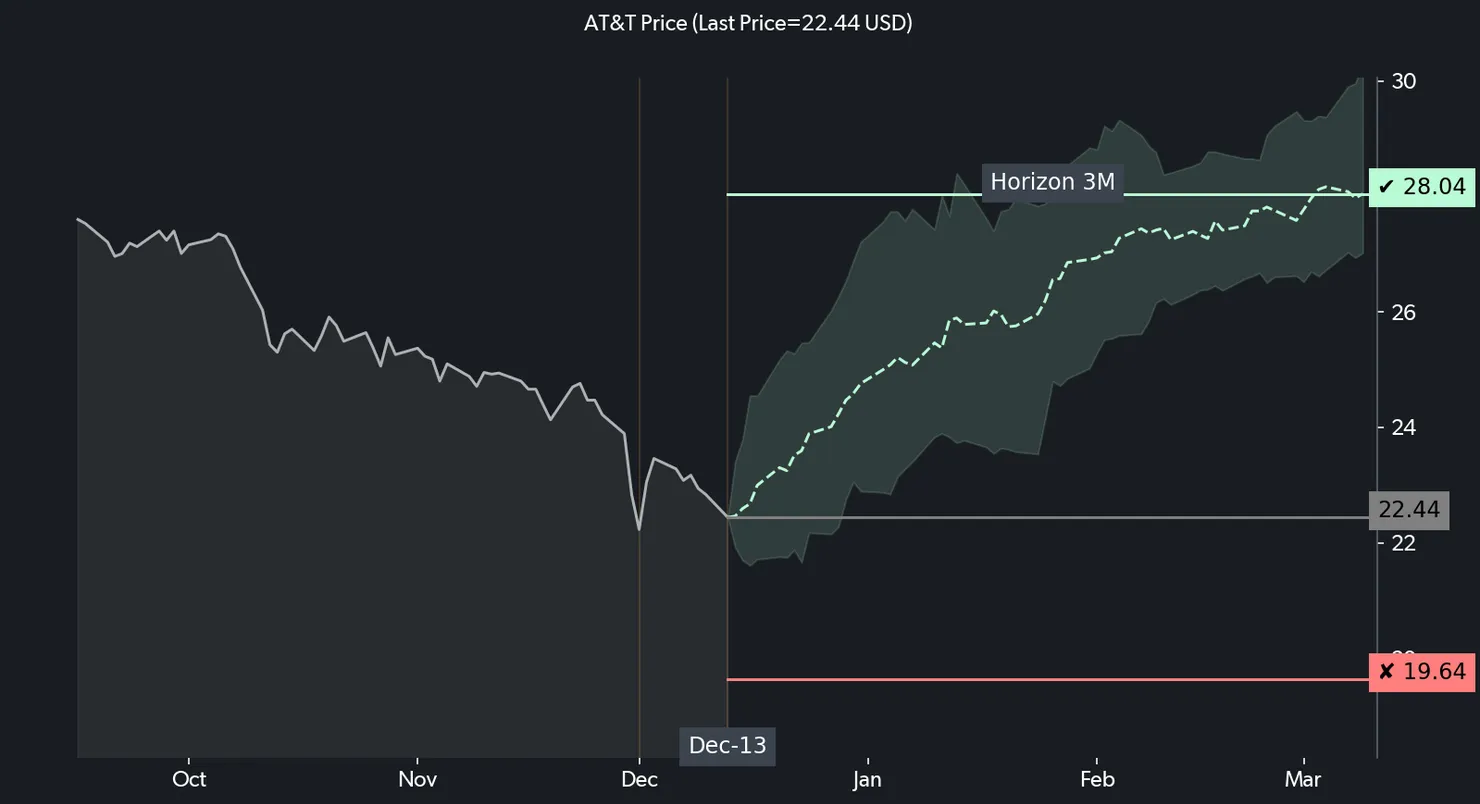
Recently, on December 14th, TOGGLE published an insight about $T, showing that AT&T stock had been trading near the bottom of its range. Based on $T’s historic performance, TOGGLE’s AI has identified that this may lead to a median increase of 25% over the following 3M, as shown in the chart below. This insight got a 5 out of our 8-star rating system (more on that later).
How did TOGGLE come up with this?
TOGGLE uses the power of machine learning and artificial intelligence to analyze data and turn it into easy-to-read insights that you can use to help your decision-making. For this particular insight, TOGGLE's AI analyzed 5 similar occasions in the past to help identify this insight's median projection and confidence band.
The dotted line you see is the expected path, which is based on similar instances in the past. The shaded area represents a confidence band, and AT&T's price typically stays within those boundaries if the stock performs like it did in the past. The flat, solid green line indicates where TOGGLE expects the asset to reach. Last but not least, the flat red line is a possible stop-loss level, the point at which $T has deviated too far from the expected path and you should reevaluate your position.
How reliable are these insights?
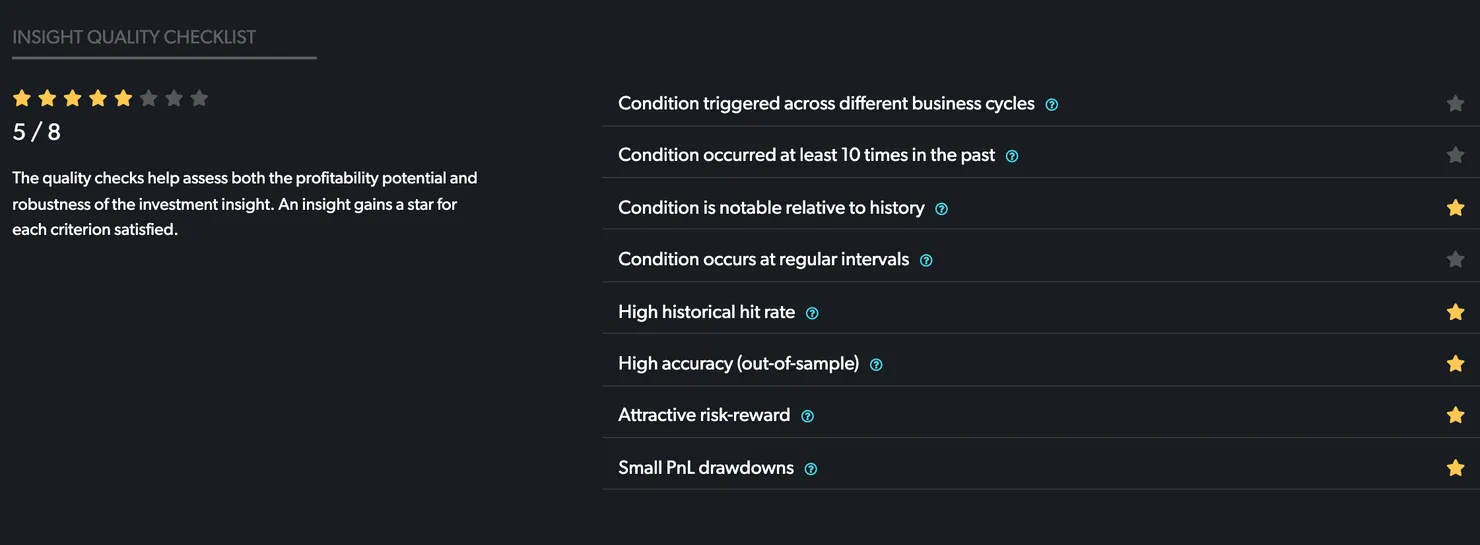
Well, that's up for you to decide. TOGGLE uses an 8-star rating system, which evaluates the same stats that institutional investors like to look at when managing money professionally. We ask questions that determine if these conditions have happened before, how accurate they've been, and how frequent they've occurred, and more. This insight received a 5 out of 8 on our star rating system (as seen below), and this encompasses the robustness of the relationship between the driver and subsequent price action.
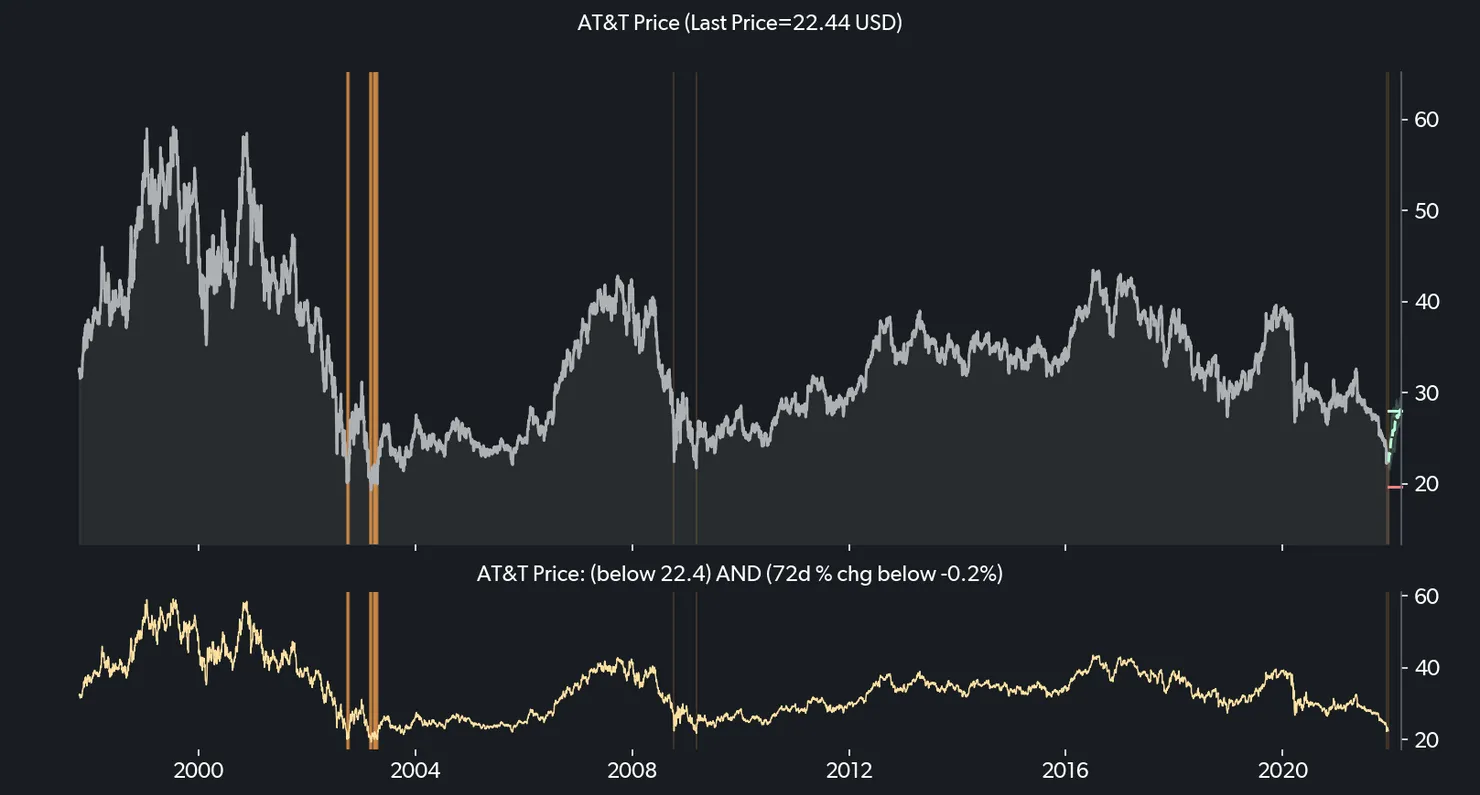
While crunching the numbers, TOGGLE also studied technical drivers and detected a consistent relationship between drivers and the subsequent asset movement. The chart below highlights the times in the past when the drivers (specifically price) were at a similar level as right now. For this insight, TOGGLE’s AI identified 5 different times, or “episodes,” when a similar set-up has happened in the past. Of those episodes, TOGGLE found that 100% of those resulted in an upward move over a 3M horizon, which helped form this insight. (Note: this hit rate was calculated against a small sample [5 distinct episodes], hence resulting in such a high hit rate)
So, how do I use this info?
Ultimately, what sets TOGGLE apart is that when it comes to investing, we won’t tell you what to do, but we’ll be here to give you the fullest picture to help you trade with confidence. We recommend reading the full insight here to get the complete picture, and better guide your decision-making.
Want access to more insights and info like backtests, fundamentals, historical occurrences? We got you. Find all of that on toggle.ai. TOGGLE Copilot subscriptions start at $9.99 a month, but you can get your first month free, no credit card required.
TOGGLE Insight: AT&T


Up Next
Dec 12
preview