Introducing Earnings Insights: AI-Driven Intelligence for Earnings Season
By Eamon Troy on November 6, 2025
4:05 PM. MSFT just released earnings, stock is down 5% and moving lower. You’re digging through to find what drove this miss.
Azure growth deceleration?
Capex guidance cut?
Any new data center partnerships?
What’s the read-through for the rest of the book?
Scan Bloomberg headlines, the press release, filing, check impulse reactions on socials. Dig through each line item. Parse what customers or segments drove cloud weakness – was it Azure specific? How does it compare vs. AWS? GCP?
Way too much to work through but seven more companies just hit the tape, names are swinging wildly, and critical position decisions need to be made.
This is your standard earnings season: reactive and rushed, stretched too thin across too many calls, too much content, and an ever-growing coverage universe.
We built Earnings Insights, powered by the Reflexivity Knowledge Graph, to change that.
Each earnings season brings thousands of quarterly reports – 10-Ks/Qs, prepared management remarks, call Q&A, analyst revisions, and market coverage. Spending 2-3 hours per company doesn’t work. Plans to read press releases, attend calls, update models, assess competitive impact, position size, and talk to the trading desk, for every company in your coverage universe, never seem to scale.
Our new product offering is powered by an AI-driven analysis pipeline that continuously processes and distills the most critical information for each company’s quarterly release.
This release features two complementary insight types designed to help users prepare and react to earnings season.
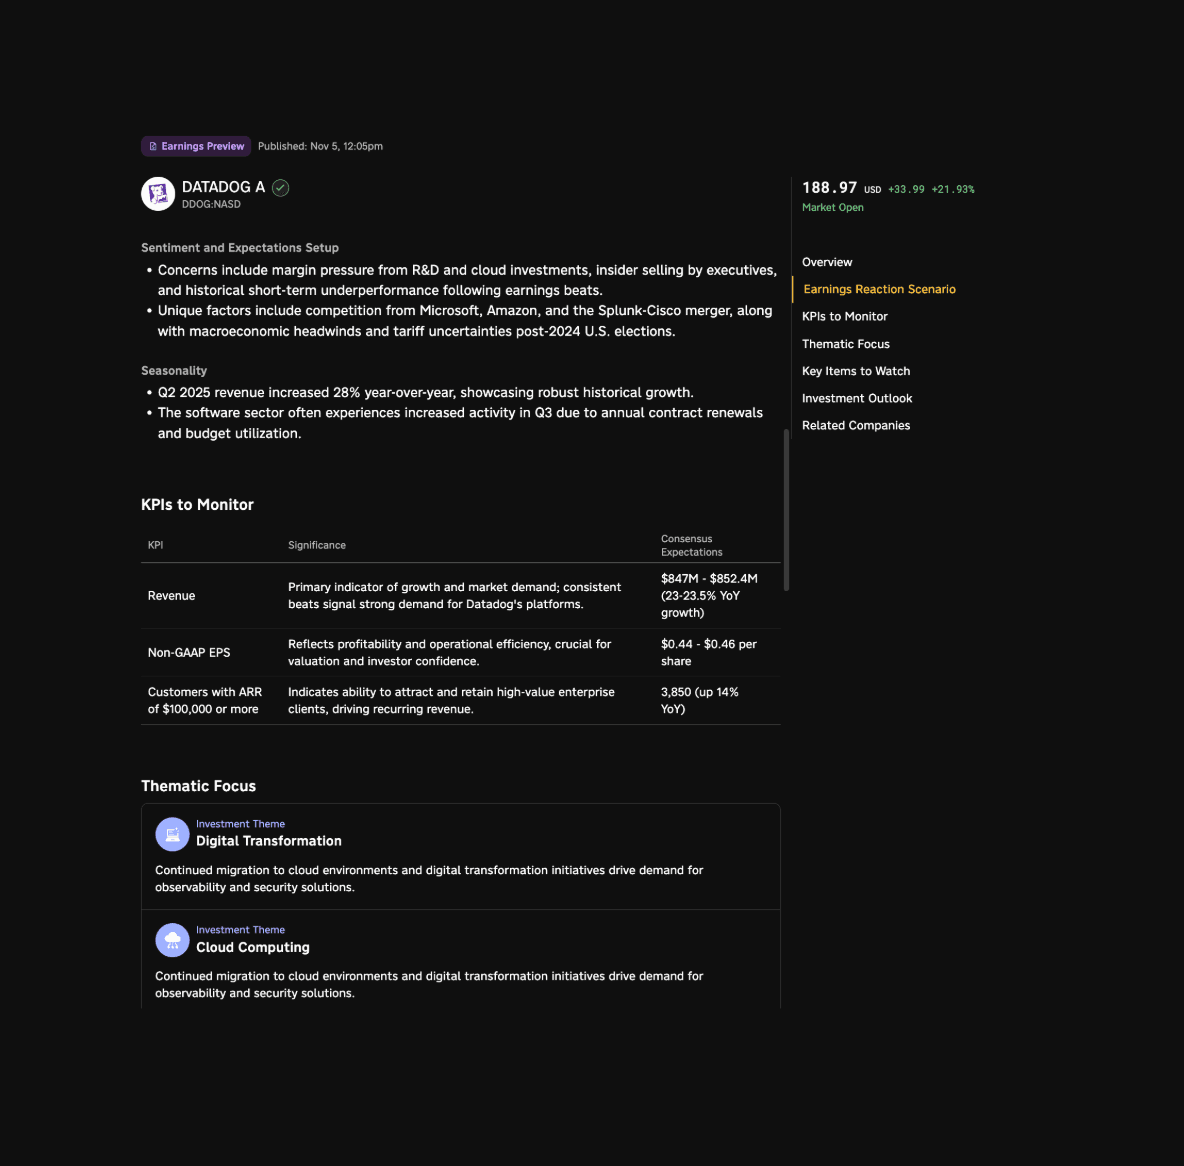
Published three days before a company reports, Previews provide the critical context users need into a quarter, including:
- Setup with historical scenario analysis
- Company-specific KPIs
- Thematic framework tracking exposure across three core categories: industry, financial, and macro
- Company impact analysis - peers most likely to benefit or suffer based on different outcomes
- Investment scenarios to watch
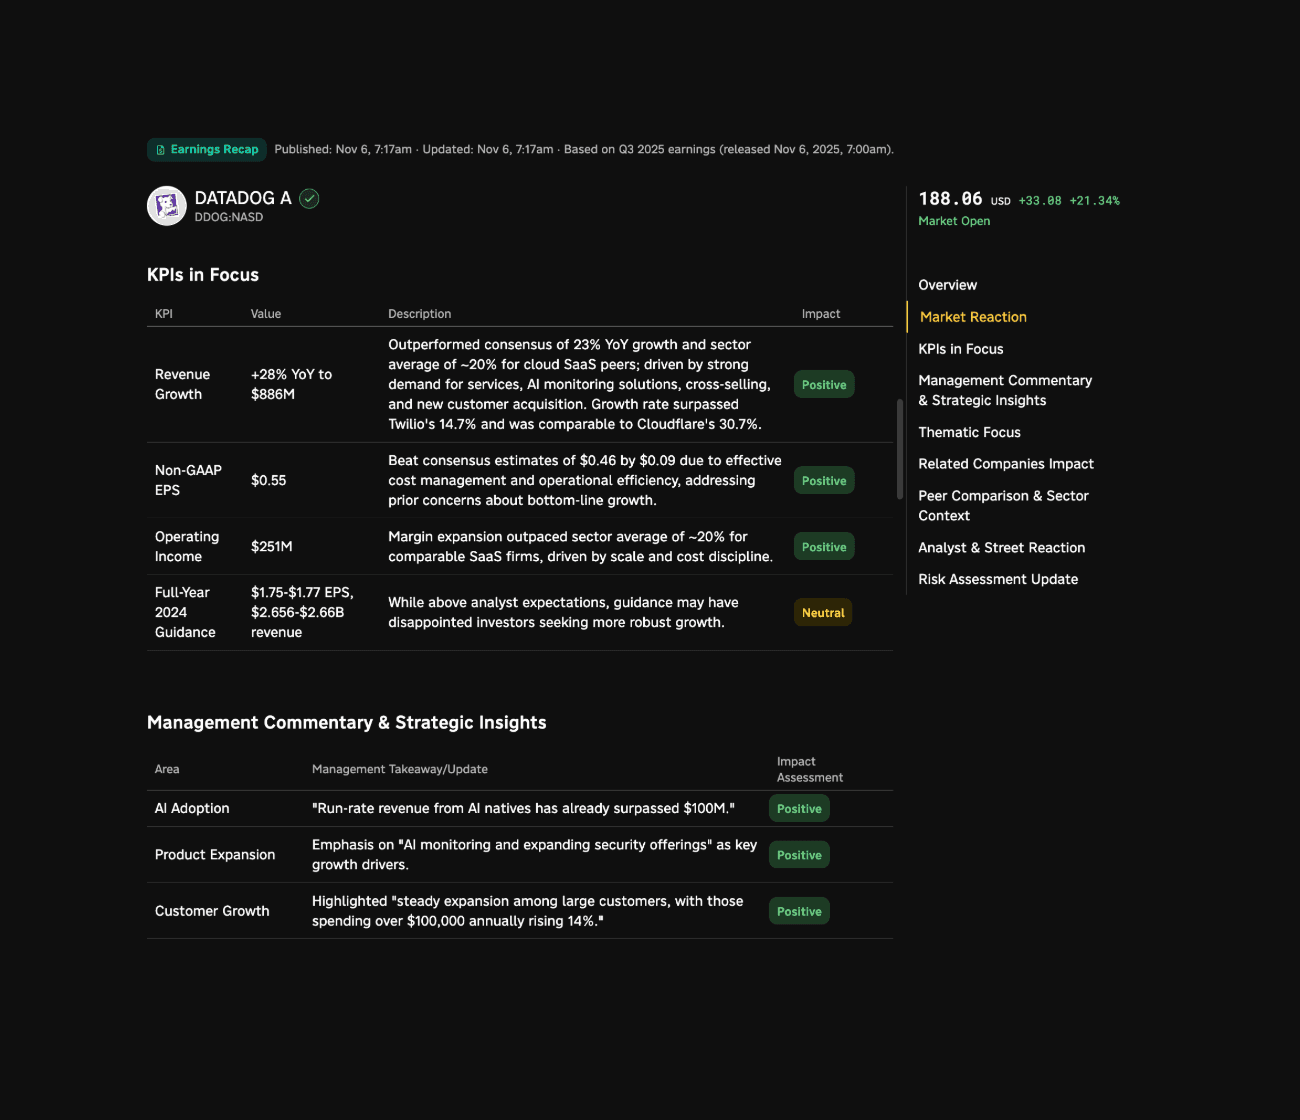
Recaps are generated within 30 minutes of a company’s earnings release and provide a concise narrative for what drove the quarter and stock reaction. These insights cover:
- Stock reaction attribution
- KPI deep dives with peer performance
- Critical management commentary
- Thematic validation
- Peer company impact
- Updated risk assessment and catalyst outlook
Sources and Data Quality
Each Earnings Insight is sourced and verified from official company disclosures, transcripts, and financial news sources. All quotes are attributed to their speakers.
Coverage
Current coverage for Earnings Insights spans all U.S. companies with a market cap over $1 billion. The platform also supports customization on source and methodology, meaning teams can incorporate their own research and proprietary data into the analysis.
What Makes This Different
These insights are powered by the relational network and processing pipeline of the Reflexivity Knowledge Graph. Our graph tracks 2,000+ investment themes, 4,000+ companies, and over 20,000 unique products, brands, and services. This network allows the Graph pipeline to automatically resolve earnings results into relevant themes, identify the most impacted companies, and determine which KPIs truly matter based on historical sensitivity, company guidance, and evolving business model dynamics.