Turn Relationship Intelligence Into Returns
Discover hidden connections across companies, themes, and markets. Our proprietary Knowledge Graph maps relationships that others miss, giving you an edge in every investment decision.
See What Others Can't
Our Knowledge Graph reveals the hidden connections that drive market movements and investment opportunities.
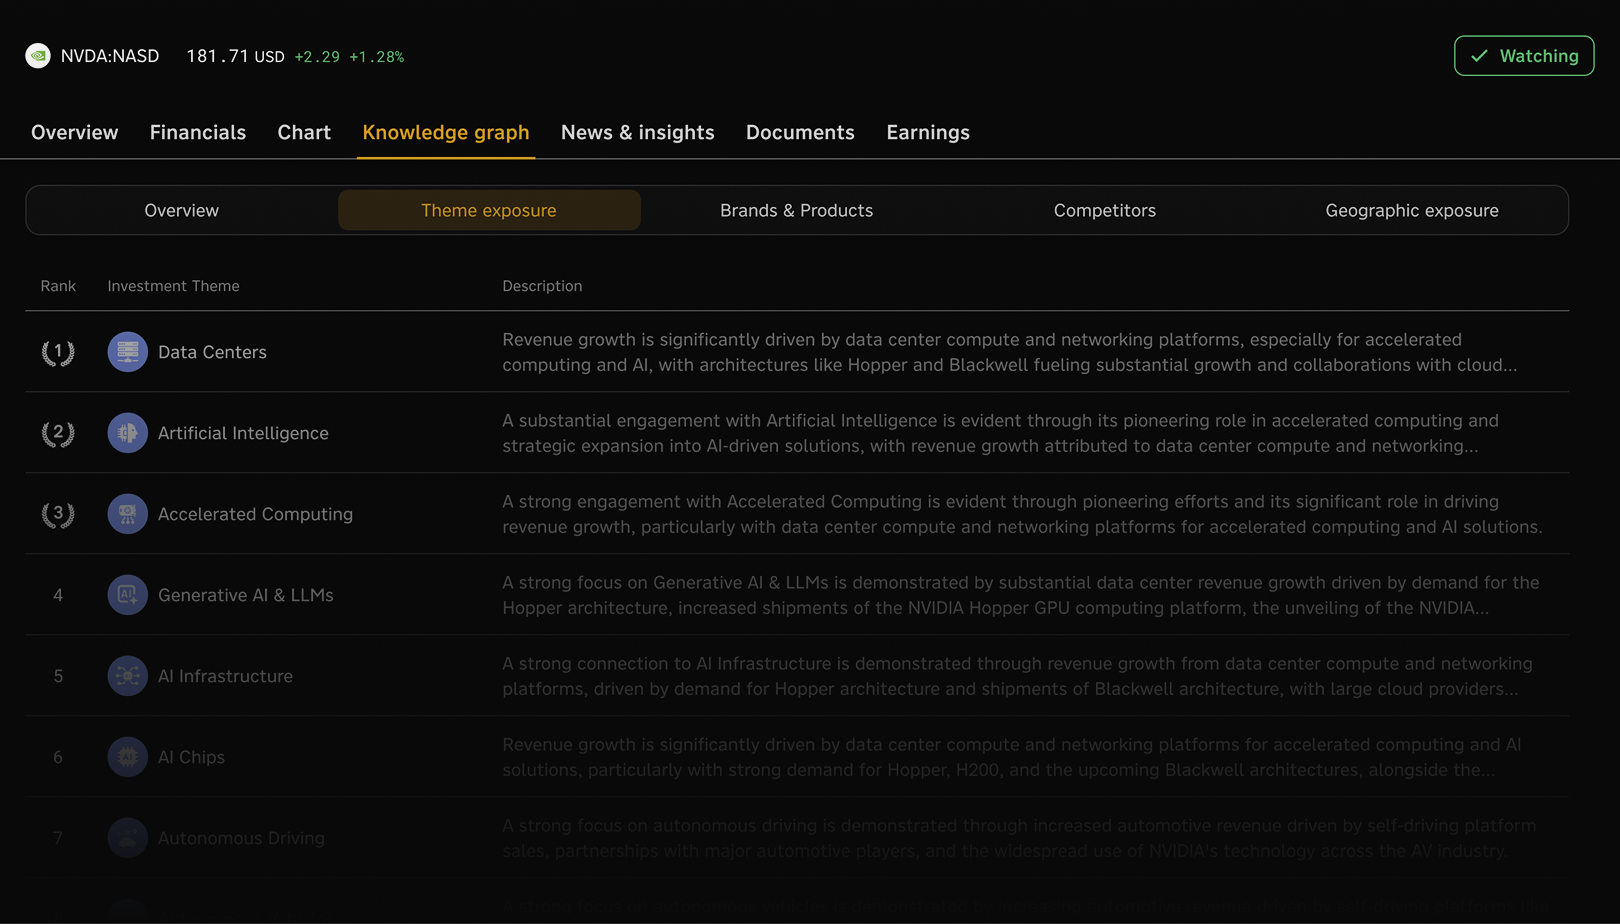
Multi-Dimensional Mapping
Map companies across themes, brands, products, geography, competitors, and suppliers. See the complete picture of every investment.
Performance Attribution
Understand what's really driving stock movements. Connect price changes to theme exposures, earnings topics, and market events.
Always Learning
Our Knowledge Graph continuously updates itself from SEC filings, earnings calls, and news events. It gets smarter every day.
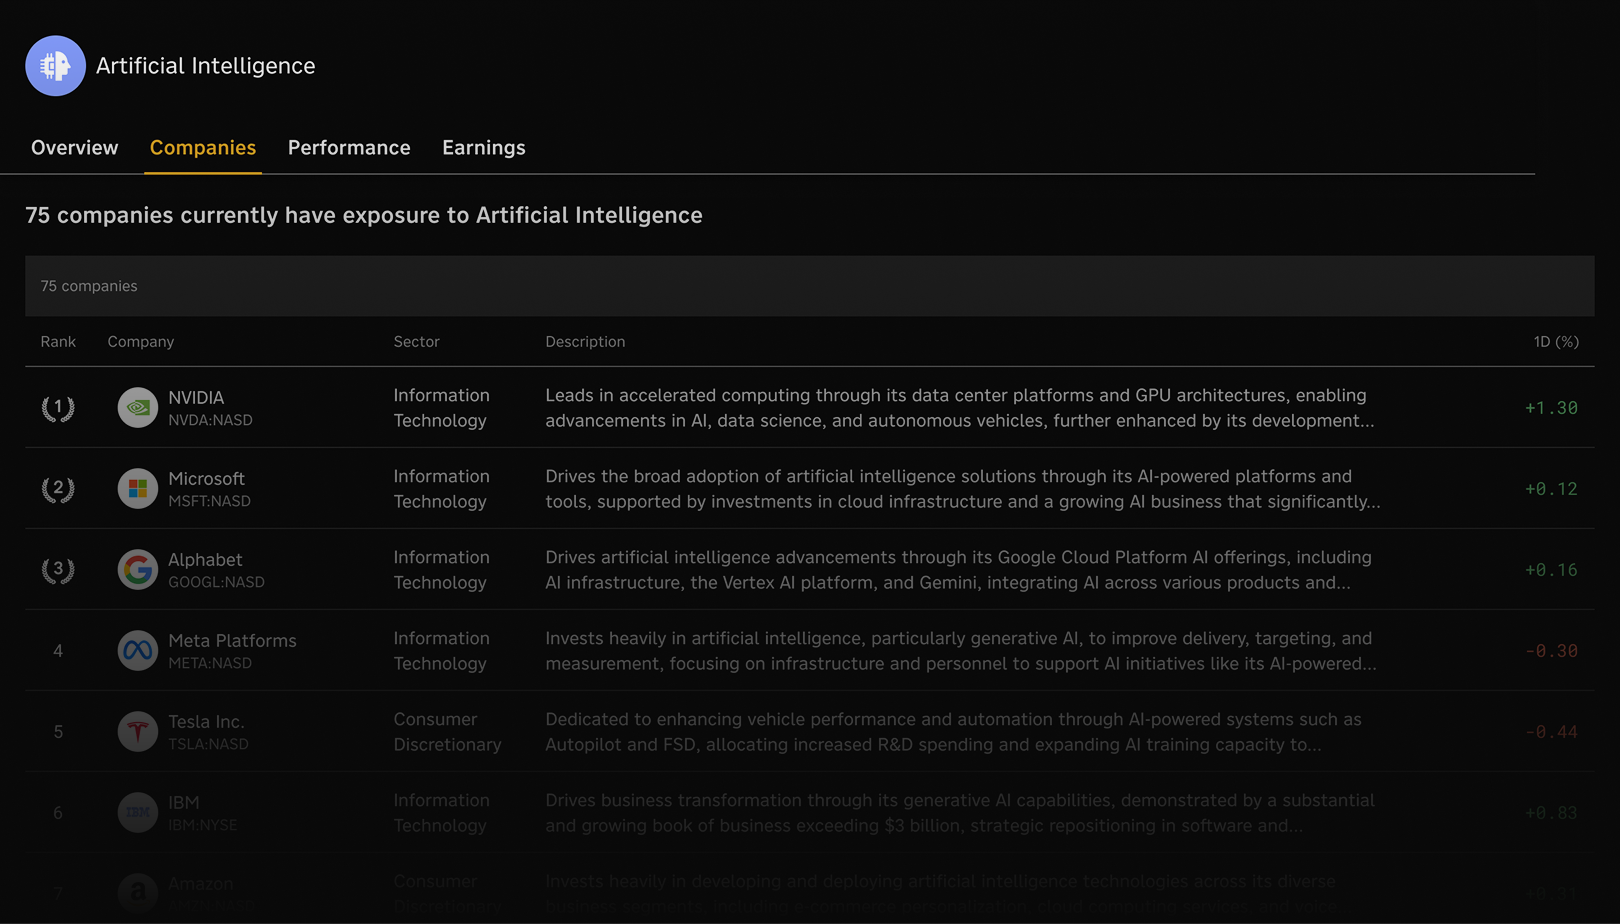
Theme Discovery
Deep dive into thematic exposures and discover other assets within those themes. Find investment opportunities through connection analysis.
Hidden Connections
Uncover second and third-order relationships that create unexpected correlations and investment opportunities.
Earnings Analysis
Identify the most important themes and topics from earnings calls and compare them across peer groups for deeper insights.
Why Our Knowledge Graph is Different
The only proprietary Knowledge Graph built specifically for institutional finance.
Exclusively Ours
No other financial institution offers this capability. Our proprietary Knowledge Graph is built from the ground up for investment analysis.
Self-Updating
Automatically learns and updates from new SEC filings, earnings calls, and market events. Always current, always accurate.
Investment-Focused
Designed specifically for investment professionals. Every connection and relationship is mapped with investment relevance in mind.
How the Knowledge Graph Works
From data ingestion to investment insights in three powerful steps.
Continuous Learning
Our AI continuously analyzes SEC filings, earnings transcripts, and news to identify and map new relationships across companies and themes.
Connection Mapping
Every piece of information is connected to create a comprehensive network of relationships across themes, geography, competitors, and products.
Investment Insights
Discover hidden opportunities, understand performance drivers, and make better investment decisions through connection-based analysis.
Comprehensive, High-Quality Data
We source financial, market, and macroeconomic data from leading global providers.